A lovely final match of the IPL 3rd version. A month long extravaganza is finally over. And apparently a lot of money has flown through - either officially or unofficially.
I wonder if any of the advertisers actually have an ROI put in place for any of the investment. I heard a CMO discuss on advertising options in one of the IPL matches. He was easy to spend over a crore rupees on this one match. After he hung up, he had only one comment ... good investment to have the CEO present the man of match award.
That got a lot of alarm bells ringing. Are marketing departments supposed to work on the brand image and acceptance or Are they PR agencies of the CEO?
I decided to question all the companies who advertised in the IPL and whose shares are owned by me. Fortunately, only Idea Cellular Limited was such a company in my portfolio. That also shows, that my portfolio is comprised of companies which focus on customer and market rather than on any fad such as the IPL.
I have sent a query, as a shareholder, to Idea Cellular Limited's invester relations asking them on the amount spent on IPL and the ROI model on which this amount was sanctioned. Am hoping to get some reply from them.
Do let me know if you own shares in any other advertisers to the IPL? If so, I urge you to send similar queries to the companies asking for ROI. Do let me know if you get a reply. Especially, if you get one where the ROI has been justified and realized. We should celebrate such a company.
Waiting for your feedback....
Sunday, April 25, 2010
Wednesday, March 17, 2010
The TIME Factor in Modeling
Last week I read a question on one of my linkedin community on whether "marketing is science or art". There was a lot of debate on it being a bit of both or more of one and less of other. I had my two bit answer to it also. I was pondering on the question. That seems a bit odd since I remember having the same question for my marketing management question during semester exams of my MBA program... the answer was by rote. Today I ponder. Does that mean I am wiser? Before you answer, that was a rhetoric. My response was that marketing was both an art and a science. The science part of marketing lies in all the theory and algorithm that is available to be applied. The art part of the marketing depends on what theory or algorithm to use.
I recall an incident at a general insurance company a few months back. The team had built a cross sell model. They had first segmented the customer base and done a product association analysis. Two particular products were found to be closely associated. For sake of confidentiality lets call them ... well... Product 1 and Product 2 (not very innovative... are we?).
The next step was to find customers who had only Product 1 and not Product 2 and treat them as the target for scoring the propensity for purchasing Product 2. The data set of the customers demography, transactions, etc., was formed and the model building and scoring process executed. The customers were ranked to give the potential base for cross sell.
While the process used was appropriate there was a major flaw in the way the scoring exercise was used. The data created for model building was derived from a cut of the customer database as of a particular time... say January 31, 2010. This is where the process went .. drastically .. wrong. A cardinal mistake committed by statistical standards.
For sake of explanation, consider three customers who have bought both Products 1 and 2. The following gives the timeline of purchase of the two products.

As can be observed, by taking last 12 months data from a cut of Jan 2010, the actual purchase of the two products were not taken into consideration. For Customer 1, the purchase of Product 2, which is the target event in this analysis, actually happened outside the period of analysis.
The correct approach would be to identify the event of purchase of Product 2. Term this period as Base period. For each customer, basis the purchase of Product 2, the base period will be different. Then take the data for 12 months past from this base period.
The reason this needs to be done is we are studying the pattern of behaviour a customer exhibits before he purchases the product. Thus, the period of analysis is relative to the purchase of the product.
The following figure shows the period for which data needs to be extracted for each customer. This is dependent on the purchase of Product 2. Notice that this period is different for each customer. In fact for customer 1, this period is way in the past and goes beyond the period that was displayed. It probably needs to be decided whether Customer 1 is a "vintage" customer and should be excluded from the analysis.

This is classic case of the wrong science applied to correct art. No doubt this cross sell campaign had a high chances of failure. And the blame to be put on the statistical model which failed to predict the correct potential base.
If you want to avoid this and similar pitfalls, I will be glad to discuss ... contact me at michaeldsilva@gmail.com.
Wednesday, February 24, 2010
Dimensions of Customer Segmentation
Discussion on customer segmentation invariably moves towards the variables or dimensions on which a segmentation exercise can be carried out. Words such as demographic, psychograpic, product purchase, transaction and interaction often pop up as possible dimension. And like the founder of a retail analytics product vendor, RFM is another definition of customer segmentation (see earlier post).
Today I attempt to list down the categories and dimension which could be input into a customer segmentation model. This list, though comprehensive, is in no way exhaustive. But I don't think this is an area of concern since not many companies could fill in a majority of these dimensions with customer data.
I have categorised the dimension into classes. For some dimension, I have also stated some sample values. I am not attempting to explain the dimension since a quick google on the meaning of the dimension name should give enough insight into its explanation and the likely values the dimension with contain in the data set.
Contact me at michaeldsilva@gmail.com if you want to discuss further on conducting a segmentation exercise for your customer base.
Today I attempt to list down the categories and dimension which could be input into a customer segmentation model. This list, though comprehensive, is in no way exhaustive. But I don't think this is an area of concern since not many companies could fill in a majority of these dimensions with customer data.
I have categorised the dimension into classes. For some dimension, I have also stated some sample values. I am not attempting to explain the dimension since a quick google on the meaning of the dimension name should give enough insight into its explanation and the likely values the dimension with contain in the data set.
1. Class: Geographic
 1.a: Region
 1.b: City size
 1.c: Density of area
 1.d: Climate
2. Class: Demographic
 2.a: Age
 2.b: Sex
 2.c: Marital status
 2.d: Income
 2.e: Education
 2.f: Occupation
3. Class: Psychological
 3.a: Needs-motivation
  sample values: shelter, safety, security, affection, sense of self worth
 3.b: Personality
  sample values: extroverts, novelty seeker, aggressives, low dogmatics
 3.c: Perception
  sample values: low-risk, moderate-risk, high-risk
 3.d: Learning involvement
 3.e: Attitudes
4. Class: Pscychographic
 4.a: Lifestyle
  sample values: economy-minded, couch potatoes, outdoor enthusiasts, status seekers
5. Class: Sociocultural
 5.a: Cultures
  sample values: Bangla, Egyptian, Indian, Nepali, Pakistani
 5.b: Religion
 5.c: Subcultures
  sample values: African, American, Asian, Hispanic
 5.d: Social Class
 5.e: Family life cycle
  sample values: bachelors, young married, full nesters, empty nesters
6. Class: Use related
 6.a: Usage rate
  sample values: heavy users, medium users, light users, non users
 6.b: Awareness status
  sample values: unaware, aware, interested, enthusiastic
 6.c: Brand loyalty
  sample values: none, some, strong
7. Class: Use situation
 7.a: Time
  sample values: leisure, work, rush, morning, night
 7.b: Objective
  sample values: personal, gift, snack, fun, achievement
 7.c: Location
  sample values: home, work, friend's home, in-store
 7.d: Person
  sample values: self, family members, friends, supervisor, manager, peers
8. Class: Benefit
 sample values: convenience, social accpetance, long lasting, economy, value-for-money
9. Class: Hybrid segmentation: implies using output of other segmentation model as an input to the current segmentation exercise.
Contact me at michaeldsilva@gmail.com if you want to discuss further on conducting a segmentation exercise for your customer base.
Tuesday, February 09, 2010
Market Segments v/s Statistical Segments
The "Mint" financial newspaper in India is covering a 33 part article covering all the consumer segments identified via market survey. The series of article is really good and a must keep for anyone interested in B2C business. You can find the articles till date at this link on the mint epaper.
The following diagram shows the map of the segments identified and that will be covered in this series by mint.
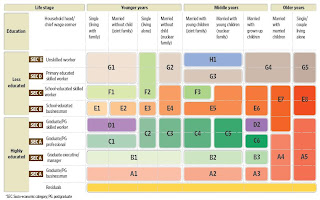
Today's blog covers the role of such market-survey driven segments and the statistically driven segment. Each has its own use.
When a company is entering a new segment or when it is new to the market, knowledge of the market is key in deciding the entry strategy. At this stage, not much is known "intimately" about the consumers in the target market. This is the stage when a market defined segment is useful. The company can evaluate the segments so defined and decide on appropriate strategy for entry as well as sustenance and growth.
Over time the company becomes successful and garners a decent size of customer base. Depending on the type of product being sold and the purchase and consumption pattern this time could vary from 6 months to 3 years or more. At this stage, the company has a significant number of customers in its fold as well as its able to capture data related to demography, transactions and interactions with the customers.
A clustering exercise at this stage to understand homogenous groups of customers will often lead to a completely different definition of segment. The following diagram is a representation of this scenario.
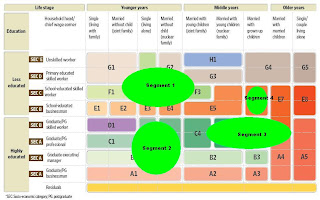
The new customer segment definition does not match the market defined segment. This is primarily because:
1. The culture of the company parentage (for example, different profiles of people get attracted to a Reliance or a TATA or a Future group),
2. The culture of the geography (for example, a retail outlet customer base will be highly influenced by the street from which it is accessible),
3. The culture of doing business (the business process followed will attract specific set of customers).
When this happens and a company is able to define and identify its customized segment, the stage is set to discard the market defined segment. The company need to realign its strategy to the identified segment of customers and plan to grow in this niche segment. Another strategy would be to identify market segments that got completely left out and define surrogate offerings to attract this segment.
I hope I have covered the role of market survey based segment and statistical segment in this brief post. In case you need to discuss on this further do drop a line at michaeldsilva@gmail.com
Monday, February 01, 2010
Perspectives of Segmentation
One of the three activities on customer analytics is segmentation. (psst: wanna know the other two... mail me on michaeldsilva@gmail.com). Most often when I discuss on performing segmentation analysis with the marketing folks.. I get the "we know our segment" arguement.
I have had marketing managers retort with "Yeah, we know what segments we target" or "we have the corporate, retail and government segment". They believe they have already segmented their segments and as such do not need analytics to further do any segmentation exercise. And they are correct. {now wait... am i contradicting?}.
It is at this point that I often take a tangential topic and take the white board for a chalk talk on the perspectives of segmentation. Let me take this opportunity to use this white space to do the same here.
There are basically three levels at which customers are segmented. The following diagram shows the three levels of segmentation.
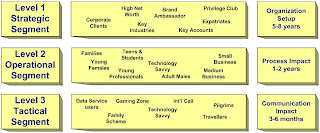
The first level of segmentation is at a Strategic level. The segment defined at this level is primarily used for organization setup. As such, this segment should survive for atleast 5 years.
The second level of segmentation is at an Operational level. The segments defined at this level dictates the processes within the organization. Each of the segments require its specific approach to selling and servicing. This segment should survive for atleast 2 years.
The third level of segmentation is at a tactical level. The segments defined at this level often requires specific communication modes. This in marketing terms, refers to specific campaigns as well as offers. The segments at this level are more of an ad-hoc nature. These segments do not survive for more than a year at the max.
The role of statistics is primarily at the third level, that is the tactical level. And this is where the mismatch happens. While me as a statistical solution provider is taking of segmentation at level 3, the marketing personnel is often referring to level 1 or level 2 segmentation. However, often the two parties are not aware of their perspective at two different levels.
I often use this theory to address the conflicting scenario during my pitch to the marketing personnel. All the best with your understanding on marketing segmentation and the role of statistics.
Subscribe to:
Comments (Atom)